UTM Tracking: Discover Where Your Reservations Come From
Alex Reservations automatically captures UTM parameters from your reservation links, allowing you to track exactly where your bookings are coming from. This feature helps you understand which campaigns, ads, and platforms are driving real reservations — giving you a clear view of your marketing performance.
Understanding UTM Parameters
UTM parameters are small tags added to your reservation page URL. When customers make a reservation using these tagged links, Alex Reservations records the source of the visit automatically.
| Parameter | Description | Example |
|---|---|---|
| utm_source | Identifies where the traffic comes from (e.g., Facebook, Instagram, Google). | utm_source=facebook |
| utm_medium | Indicates the marketing channel type (e.g., social, cpc, email, referral). | utm_medium=social |
| utm_campaign | Refers to the specific campaign or promotion. | utm_campaign=spring_special |
| utm_content | Differentiates ads or links within the same campaign. | utm_content=banner1 |
| utm_term | Captures keywords or search terms for paid campaigns (e.g., Google Ads). | utm_term=restaurant+barcelona |
✅ Example of a full tracked link:
https://yourrestaurant.alexreservations.com?utm_source=instagram&utm_medium=social&utm_campaign=summer_menu&utm_content=story_ad
Whenever a customer completes a reservation using this link, Alex Reservations stores the UTM parameters automatically for that booking.
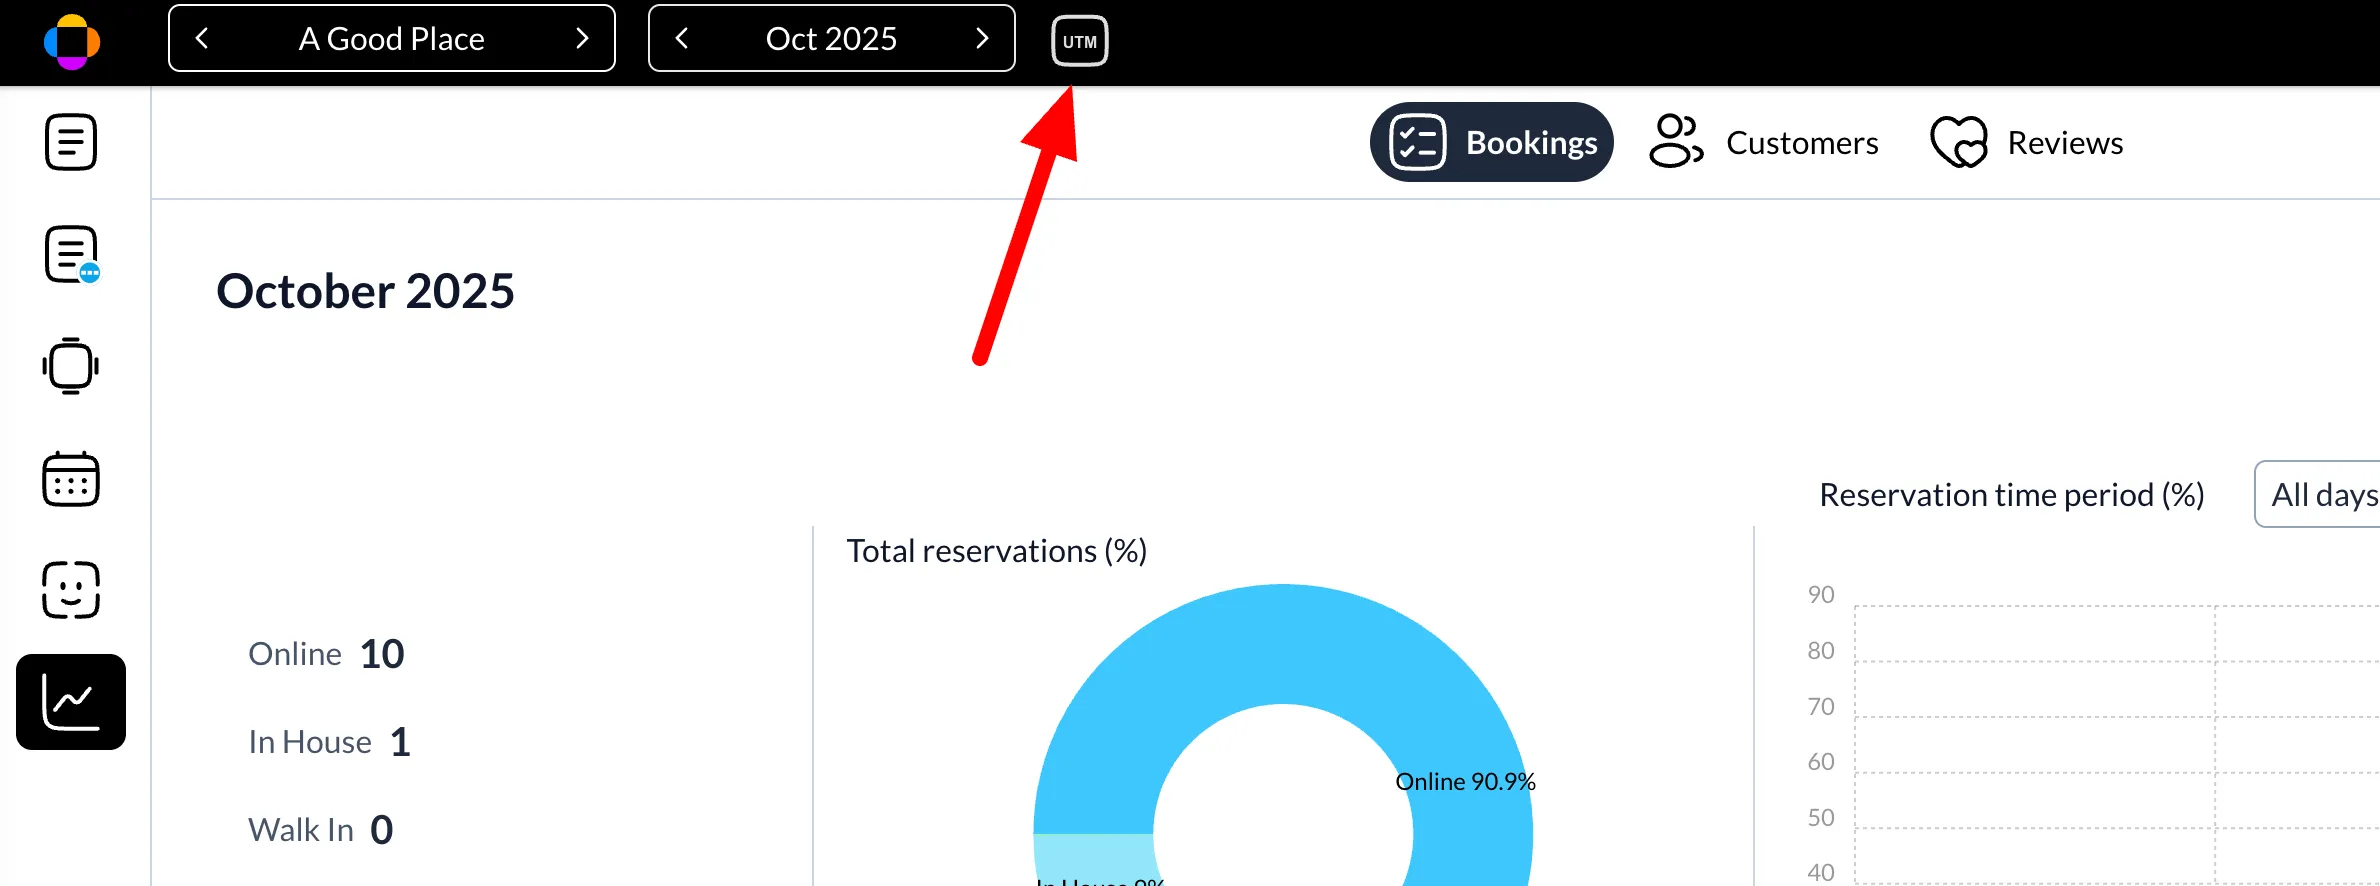
Accessing the Tracking Dashboard
To view your campaign performance, open your Dashboard and go to the Trackings section. This page displays all your reservation sources, grouped by campaign and channel.
Campaign Performance Charts
The Trackings Dashboard provides a complete visual overview of your marketing performance. Each chart and metric helps you understand how your UTM campaigns are driving reservations and where your best results come from.
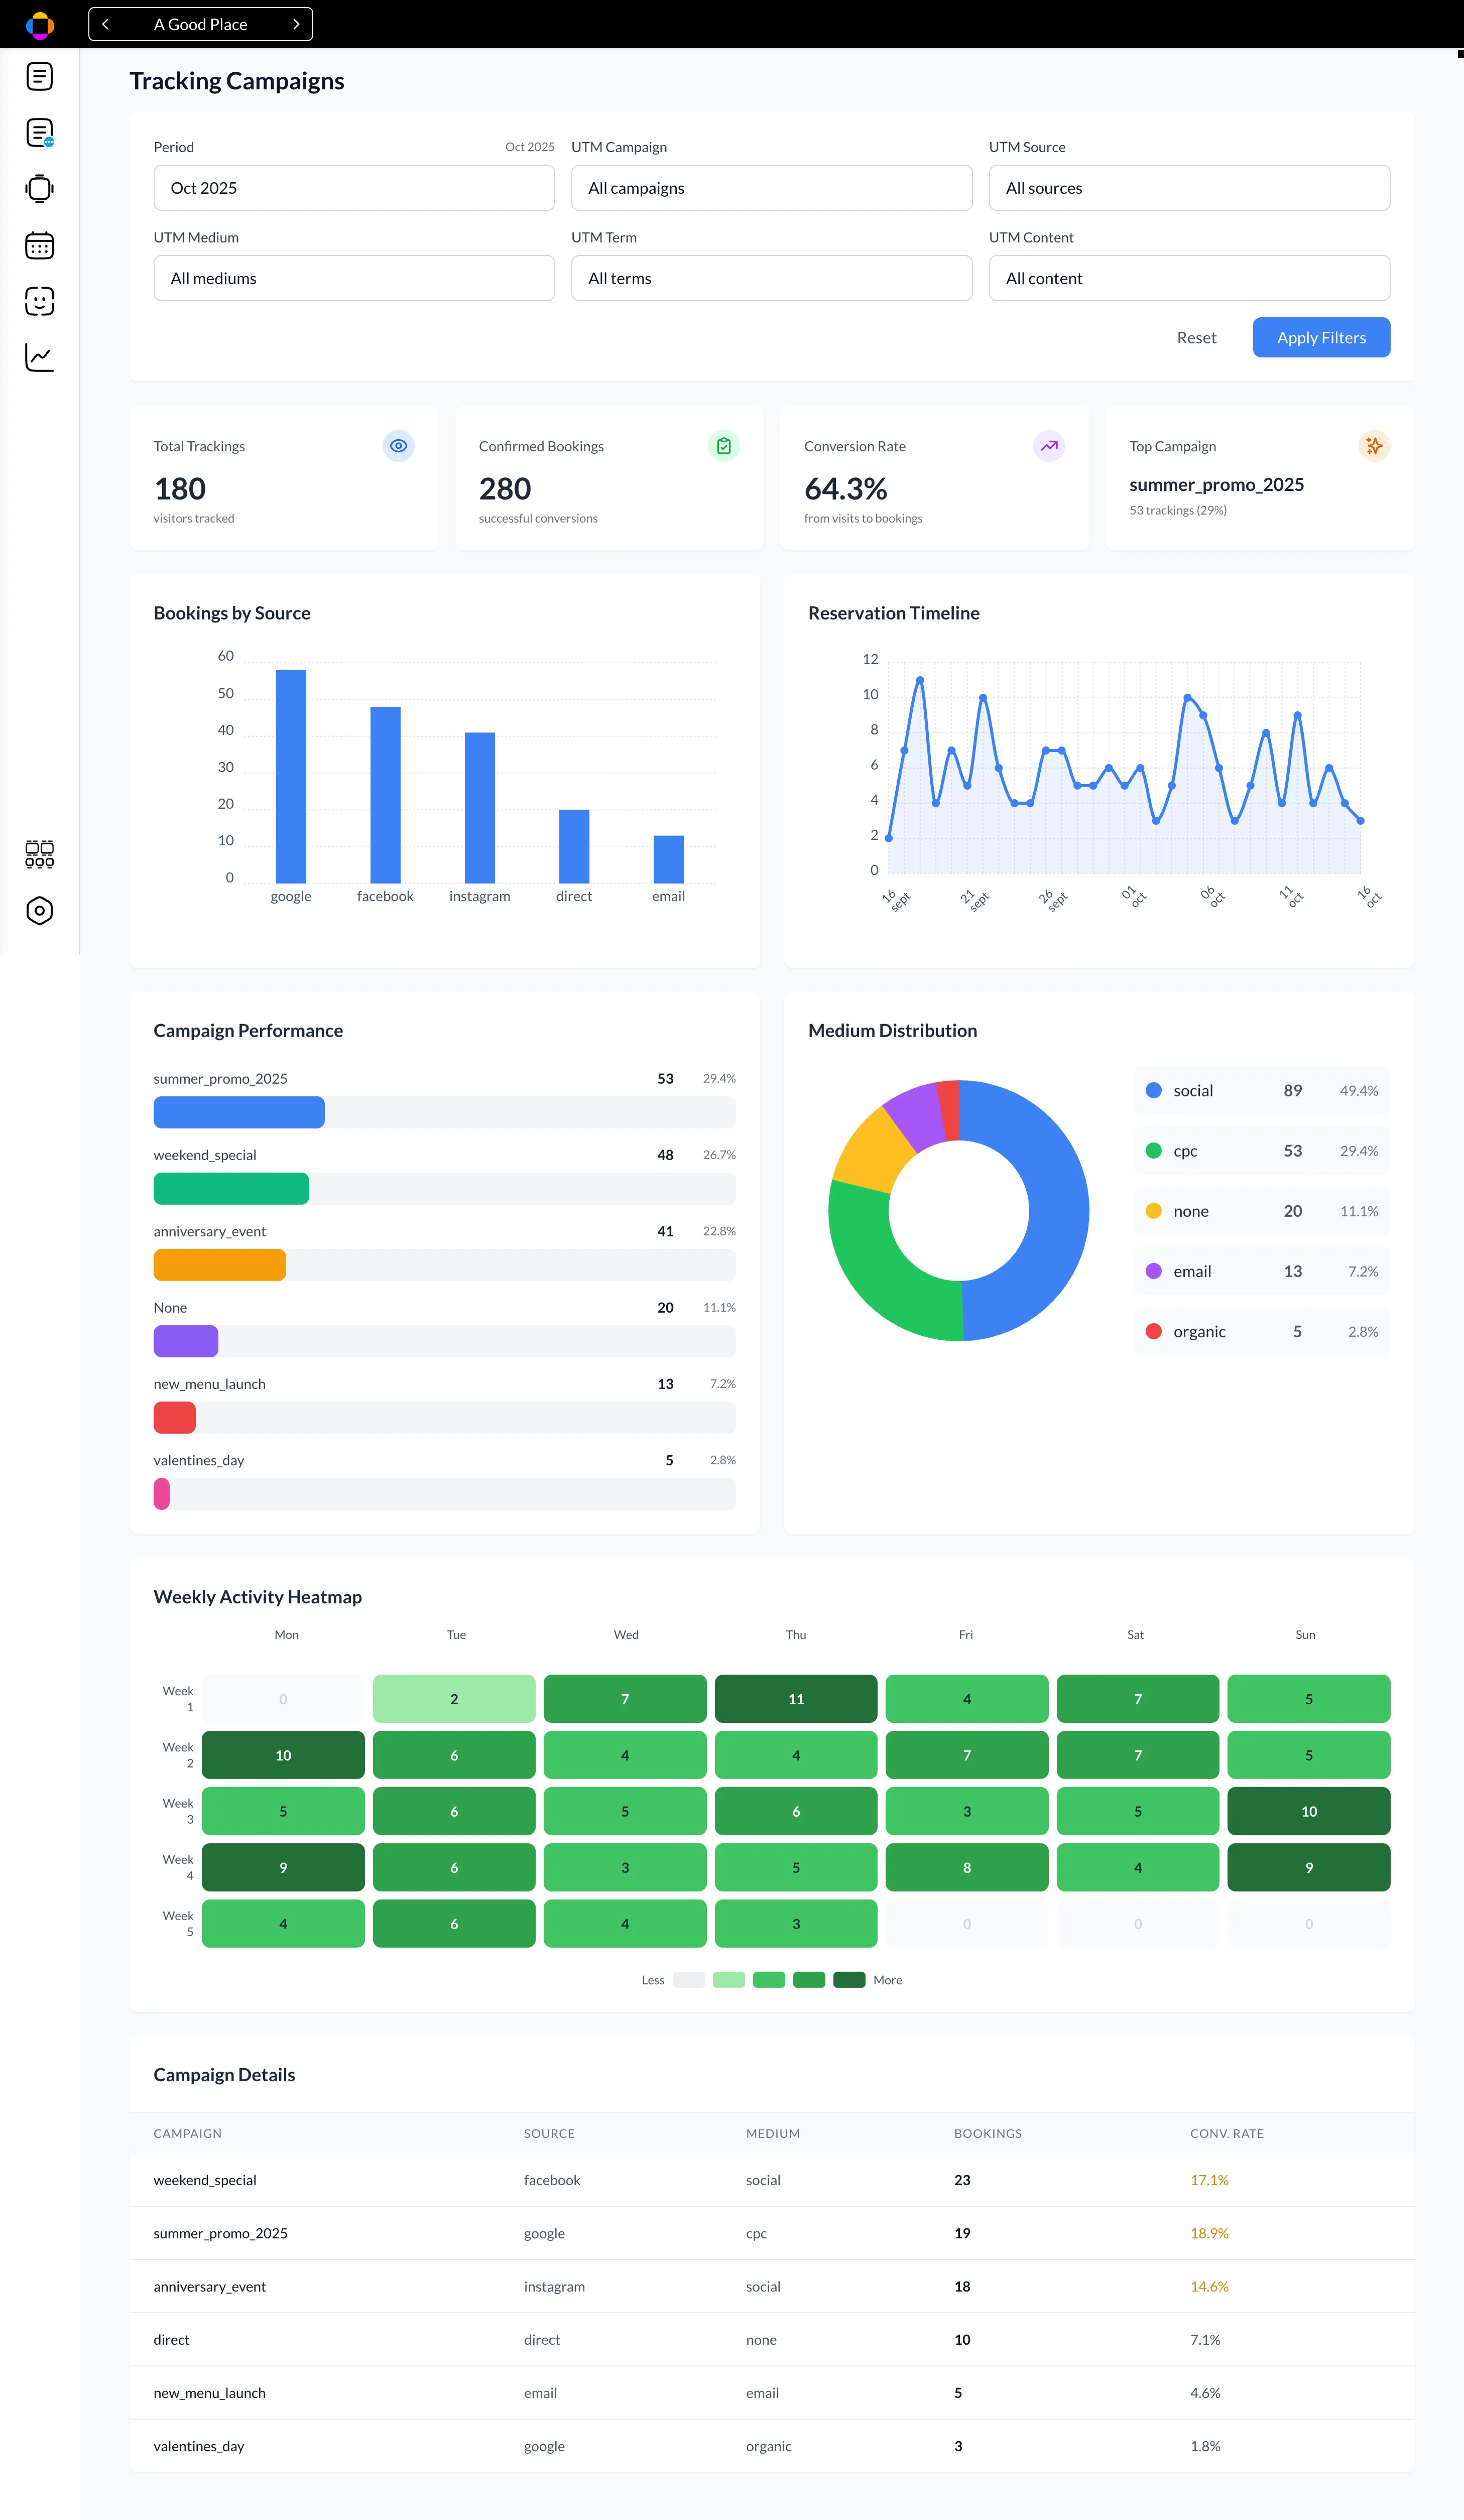
You’ll find the following insights:
1. Bookings by Source
A bar chart showing which traffic sources generated the most reservations — such as Google, Facebook, Instagram, Direct, or Email. This helps you identify your most effective platforms.
2. Reservation Timeline
A line chart displaying how reservations evolved over time during the selected period. It highlights peaks and trends in booking activity, showing how each campaign performs day by day.
3. Campaign Performance
A breakdown of all active campaigns, ranked by the number of tracked visits or confirmed bookings.
Each campaign shows its contribution percentage, so you can immediately see your top performers — for example, summer_promo_2025 or weekend_special.
4. Medium Distribution
A colorful donut chart that visualizes how different marketing mediums (e.g., Social, CPC, Email, Organic, Direct) contribute to total reservations. It gives you a clear view of which channels convert best.
5. Weekly Activity Heatmap
A heatmap showing booking activity by day and week. Darker colors represent higher engagement — helping you spot the days of the week when customers are most likely to book.
6. Campaign Details Table
At the bottom, a detailed table lists every campaign with its source, medium, number of bookings, and conversion rate. This makes it easy to compare real performance metrics across all your campaigns.
These insights help you quickly identify which marketing channels deliver the best ROI — whether it’s Meta Ads, Google Ads, newsletters, or partner links.
Why UTM Tracking Matters
- Measure campaign performance: Know which ads or channels bring real reservations.
- Optimize marketing spend: Focus your budget on the sources that convert best.
- Track ROI in real-time: View bookings and revenue directly from your marketing links.
- Understand customer journeys: See how users discover your restaurant or brand.
With Alex Reservations’ UTM tracking, your marketing data becomes actionable — helping you grow smarter and faster.